...
| Panel |
|---|
EMP system is modulated according to the Perpetual Inventory system. Therefore, the Cost of Goods Sold (COGS) is not reflected in the Profit and Loss Statement, instead the Inventory Cost will be reflected. Therefore, the COGS is formulated in the Stock Flow Report. |
- Select the fields company date range & click on Generate Report Now.

The Stock Flow Report calculates the COGS from the Opening Stock, Closing Stock and Reset MA. |
...

- The following image indicates how the calculation for COGS is performed within the Stock Flow Report and the amount will be reflected in the Profit and Loss as in Inventory Cost.
- The closing stock calculated in Stock Flow Report will be reflected in the Balance Sheet.
...

- Select Company
- Select Date Range
- Click Generate Report Now

- Stock Flow will alert on the rounding amount error → you may refer to "Adjustment suggested due to rounding on transaction calculation"

- The details on affected transactions type will be listed when user click on the Blue amount under the row; "Adjustment suggested due to rounding on transaction calculation"
- User may key in the GL Code to where the rounding adjustment will be transferred → example: "Rounding" GL Code
- The function will be DISABLED if financial year is NOT EXISTING
example:
Financial Year IS EXISTING


Financial year IS NOT EXISTING


| Info |
|---|
For Error Checking, user may perform Accounts Health Check to compare the reports. reports
(A) To get the data for SBR-05: Menu Path: Reports > Stock Reports > Stock Balance Report > Historical Stock Balance
(B) To get data for Balance Sheet: Accounting > Financial statement > Balance Sheet Select the Company, fill the Date for opening & closing. Click on Generate Report: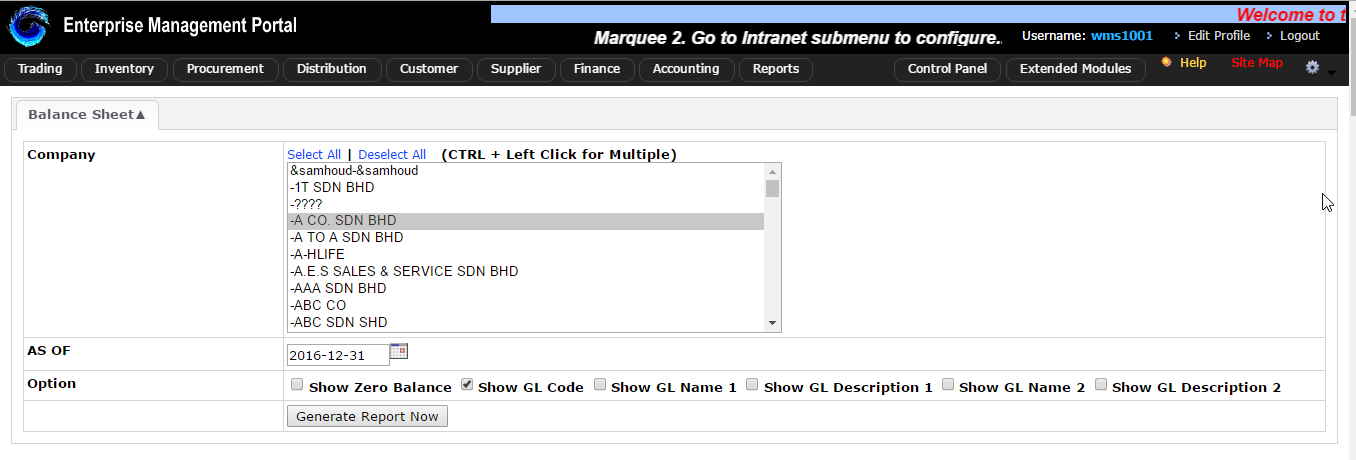 
|


Found any amount in Difference column -> Please report to Technical Support Team
NOTES:
- The following image indicates how the calculation for COGS is performed within the Stock Flow Report and the amount will be reflected in the Profit and Loss as in Inventory Cost.
- The closing stock calculated in Stock Flow Report will be reflected in the Balance Sheet.

Related WIKI Pages:
| Panel | ||||||||||
|---|---|---|---|---|---|---|---|---|---|---|
|